Debugging
Overview:
-
Read the error
- including stack traces
Read the code
Add print statements (
console.login JavaScript)-
Use an Interactive debugger
- in the browser
*in VSCode
- Use a rubber duck
What is Debugging?
Debugging is fixing code that you thought was working... but isn't working.
It's solving a puzzle that you created for yourself.
This can be frustrating! It can also be rewarding, and can lead to better understanding of your program and of the context in which it operates.
Errors vs Failures
Roughly speaking, there are two scenarios for debugging:
- failures: the program runs to completion, but gives an incorrect or unexpected result
- errors: the program exits with an error message
Debugging Failures
Debugging is an art, not a science. But its principles are scientific:
- Make a mental model of the system
- Think of hypotheses
- Make observations to confirm or reject those hypotheses
- Focus on anomalies
- Change one thing at a time and observe the results
Debugging with Print Statements
The most fundamental way to debug is to print the values of variables at various points in your code.
function factorial(x) {
    console.log("in factorial: x=" + x);
    if (x < 1) {
        console.log("x<1");
        return x;
    } else {
        console.log("multiplying " + x + " by factorial(" + (x-1) + ")")
        return x * factorial(x - 1);
    }
}
Keep adding print statements until you find an anomaly; repeat until you find the source.
Don't forget to remove the print statements after you've fixed the bug!
Debugging with Print Statements Cont.
Output of the above:
> factorial(4)
in factorial: x=4
multiplying 4 by factorial(3)
in factorial: x=3
multiplying 3 by factorial(2)
in factorial: x=2
multiplying 2 by factorial(1)
in factorial: x=1
multiplying 1 by factorial(0)
in factorial: x=0
x<1
0
Can you figure out the bug?
Breakpoints
A 'breakpoint' is a location in your code where you tell the program "Stop! And wait for me to tell you to continue." Break points can are an integral part of any debugging tool and allow you to step through your code line by line (or chunk to chunk) to figure out exactly where things went wrong
VSCode's Debugger
There is a debugger tool built right into VSCode. This debugger allows you to set breakpoints by clicking just to the left of the line number. A faded red circle will appear when you hover over a valid location, and a solid red circle will appear at the breakpoint once you click.
If you click the Debug icon on the left side of your editor it will open a box to the left that will display outputs.
VSCode Debugger Example
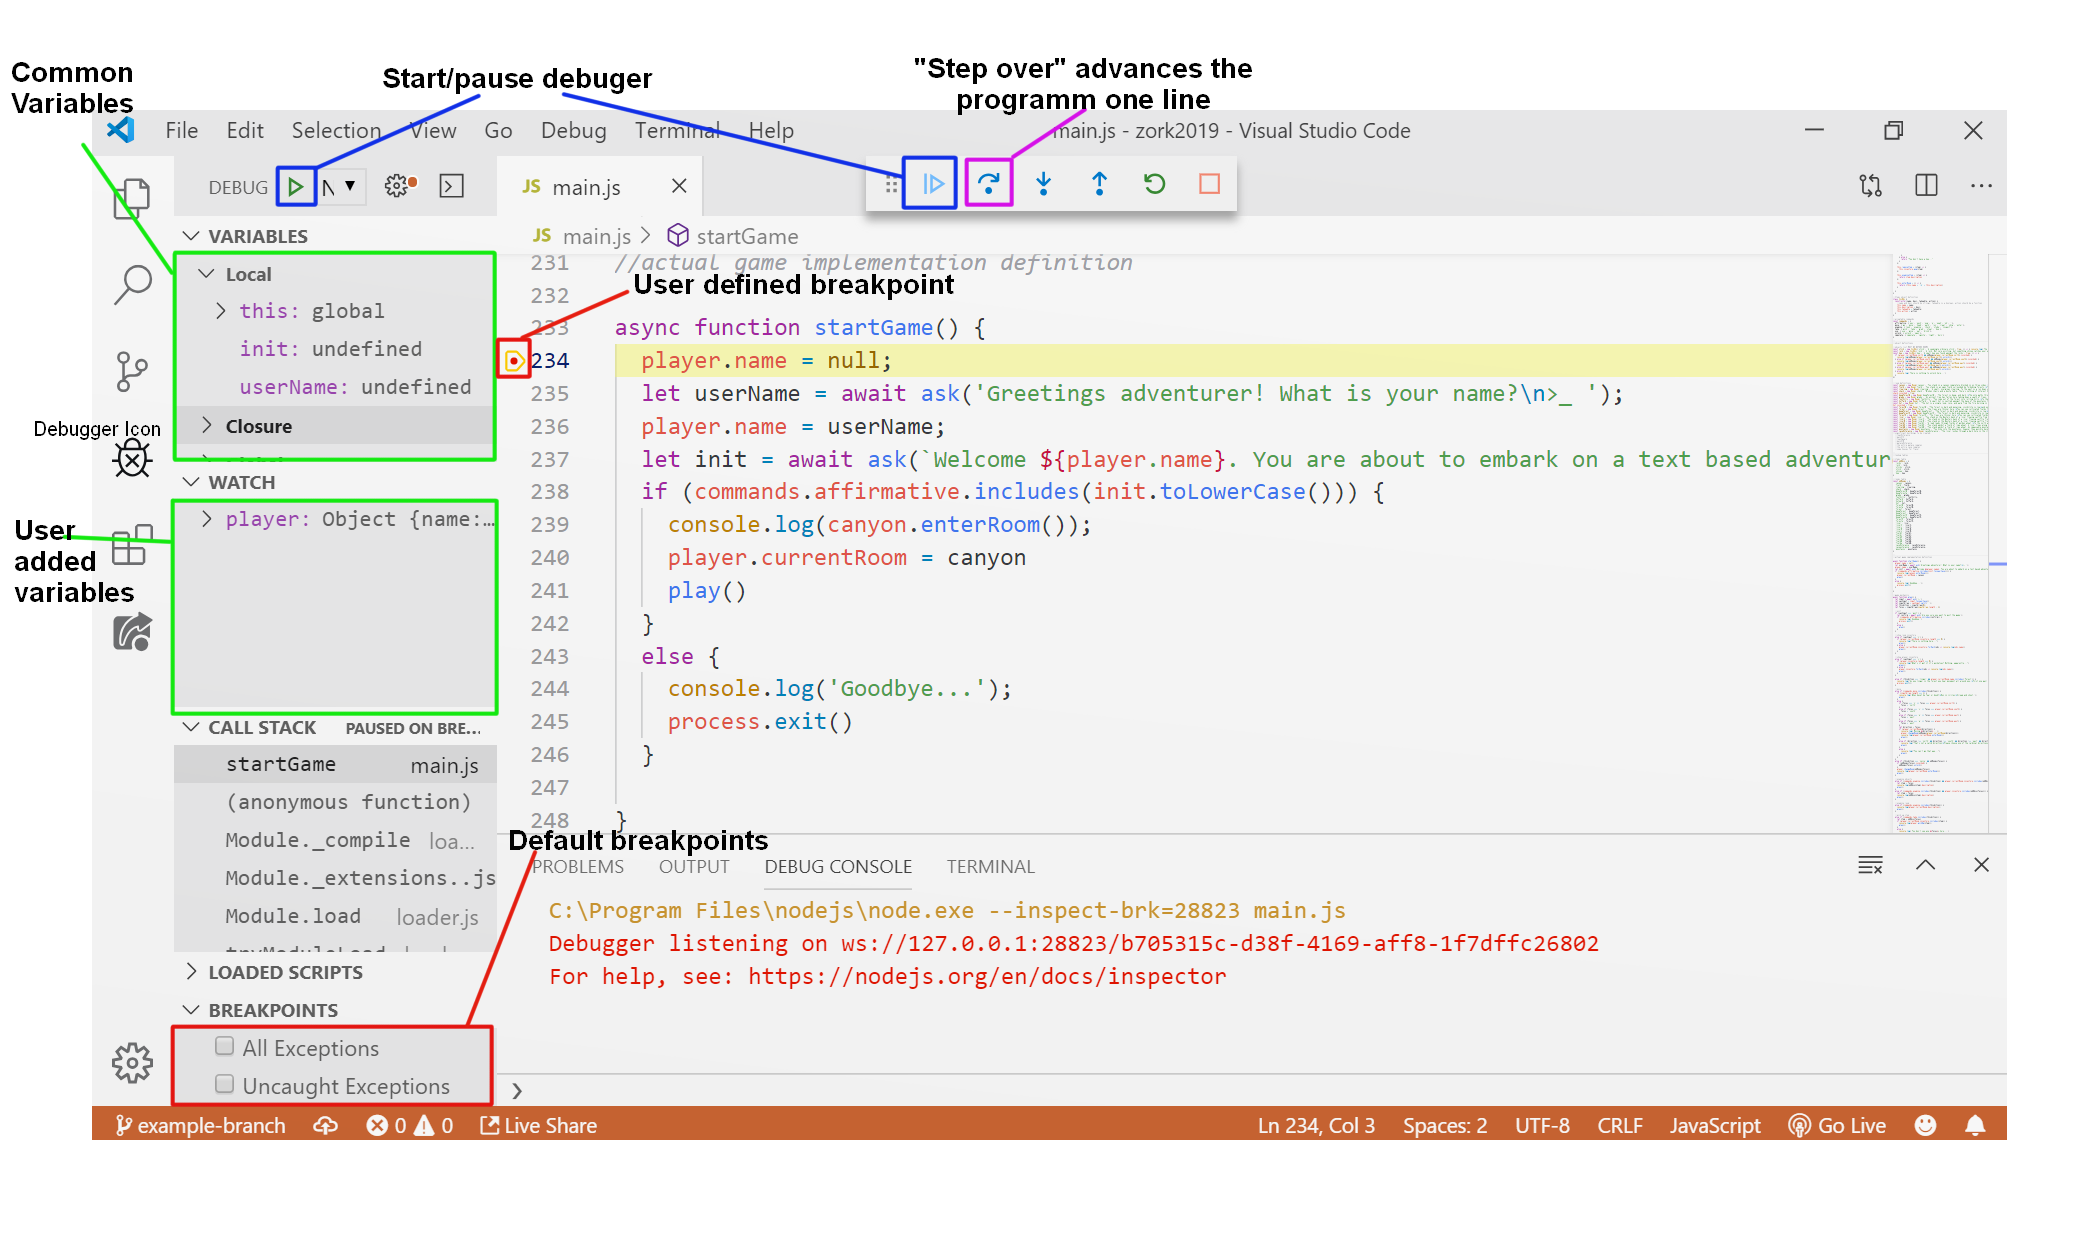
But Wait! There's More!
The VSCode debugger also allows you to track the value of variables or expressions through the execution of your code. To add a variable to watch:
go to the
WATCHsection of the box(?) to the leftClick the
+(Add Expression) button and type in the variable name you want to trackStep through your code and watch as the variable changes (or doesn't)
-
Look at the
CALL STACKsection (just belowWATCH).- Where did your code break?
- Was your tracked value what you expected it to be at this point?
Rubber Ducky Debugging
Rubber Ducky debugging is a simple way to debug a problem with no technology required.
grab an inanimate object, preferably made of rubber and shaped like a water fowl
Tell it what you're trying to do
Explain what you think your code is doing
Often times talking through a problem will help you find a solution.
You can also do this with other people! You don't have to use an inanimate object.