Step 2a breakdown
If you're running a program through your browser most modern browsers (i.e. Chrome, or FireFox) have built in debugging tools you can use!
In Chrome:
ctrl + shift + i for a Windows machine
inspect from the drop-down menucmd + option + i for a Mac
option + click and select inspect from the drop-down menuIn FireFox:
ctrl + shift + c for a Windows machine
Inspect Element from the drop-down menucmd + option + c for a Mac
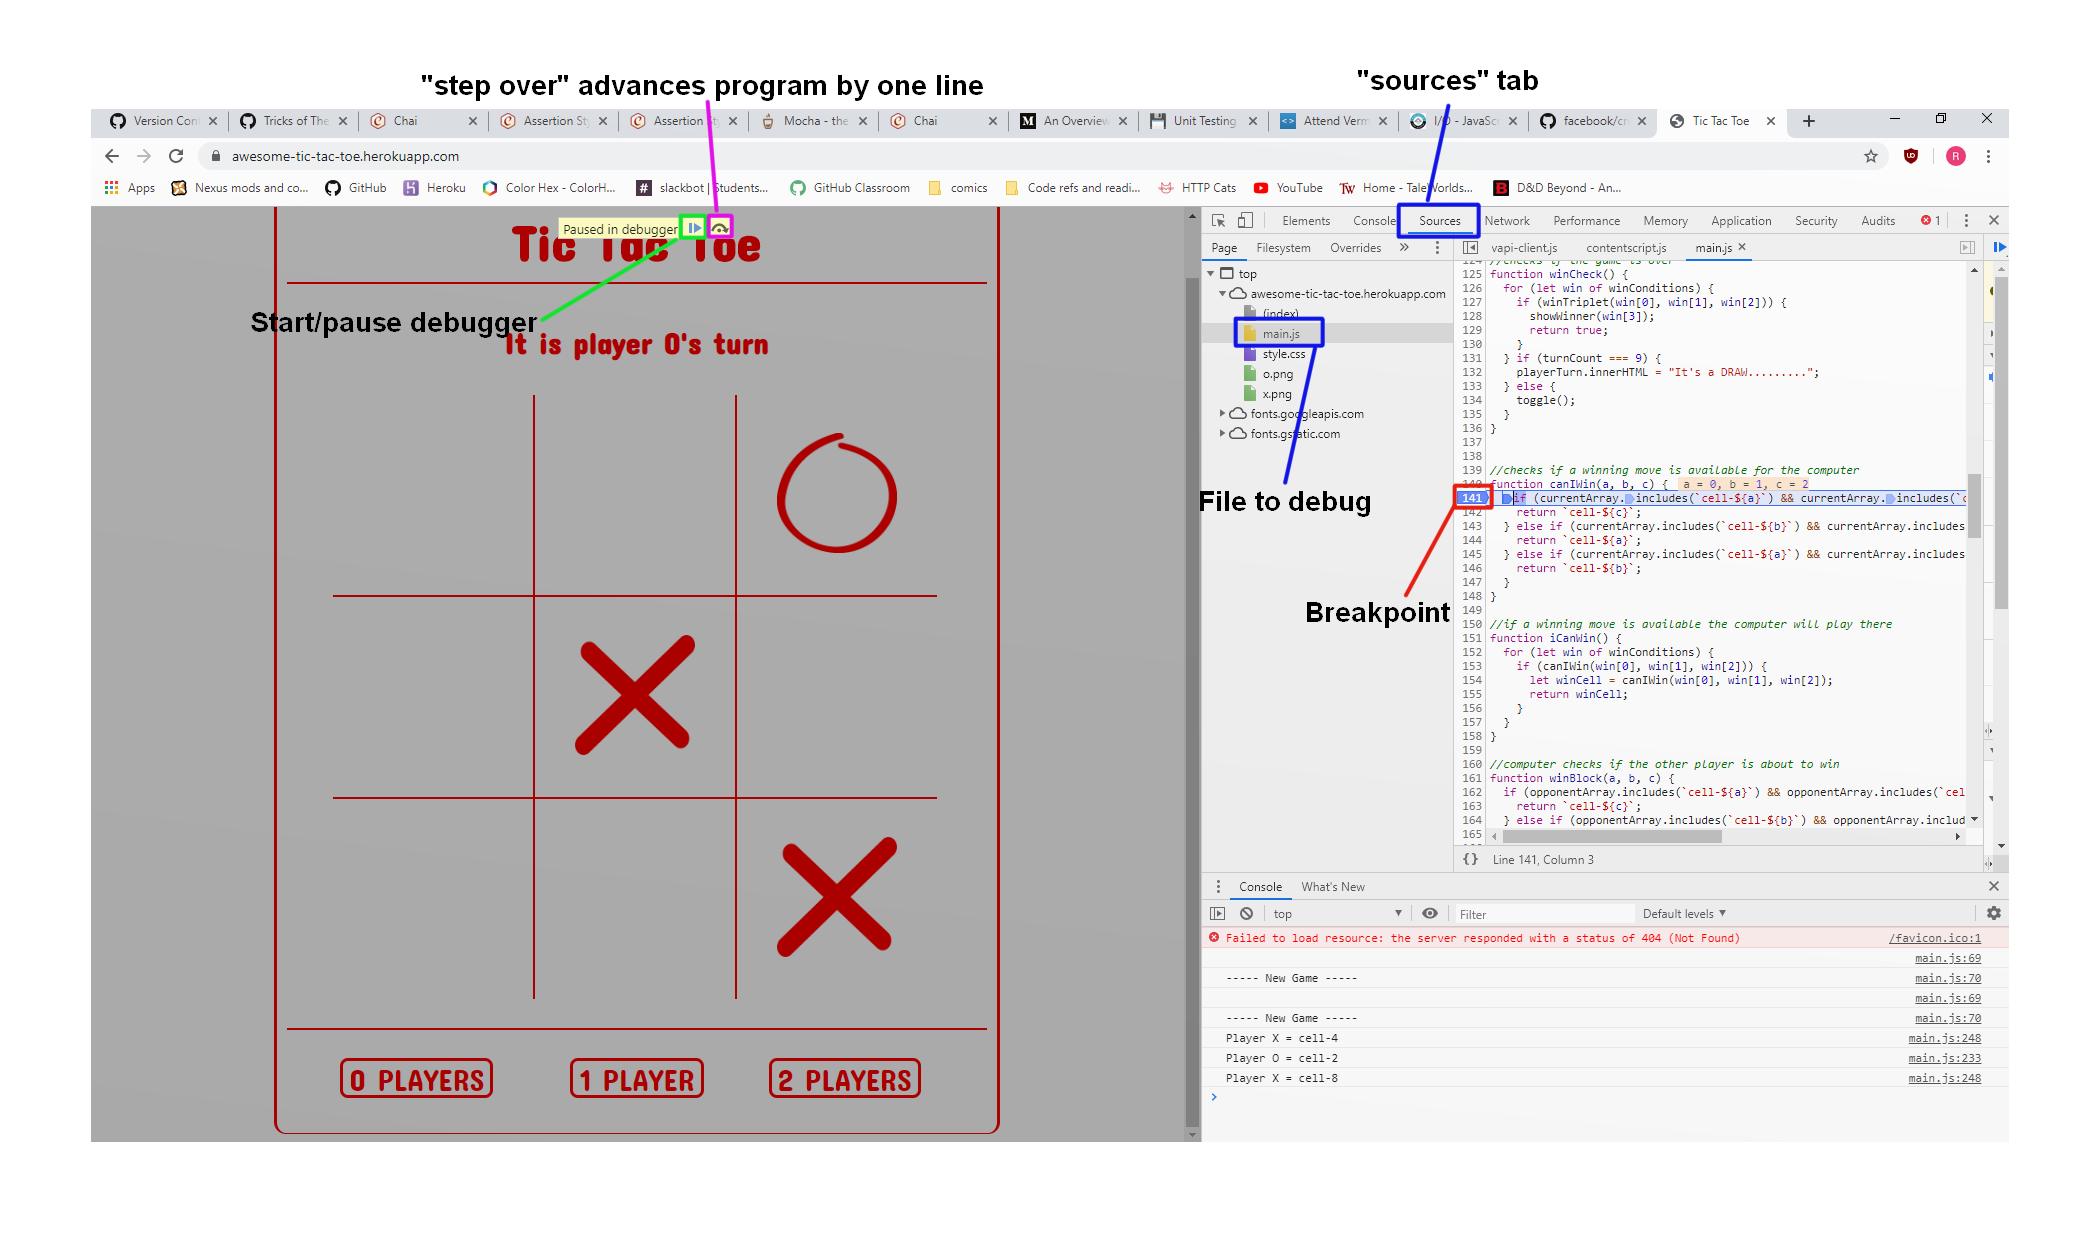
option + click and select Inspect Element from the drop-down menuIn the dev tools, navigate to the Sources tab (to the immediate right of the console tab)
Select the file you want to debug
Click on the line number where you want to add your breakpoint
Note: If you're unsure where your error is coming from you can add a break point at the top of your code and step through your whole program line by line
In the dev tools, navigate to the Debugger tab (to the immediate right of the console tab)
Select the file you want to debug from the Sources section
Click on the line number where you want to add your breakpoint
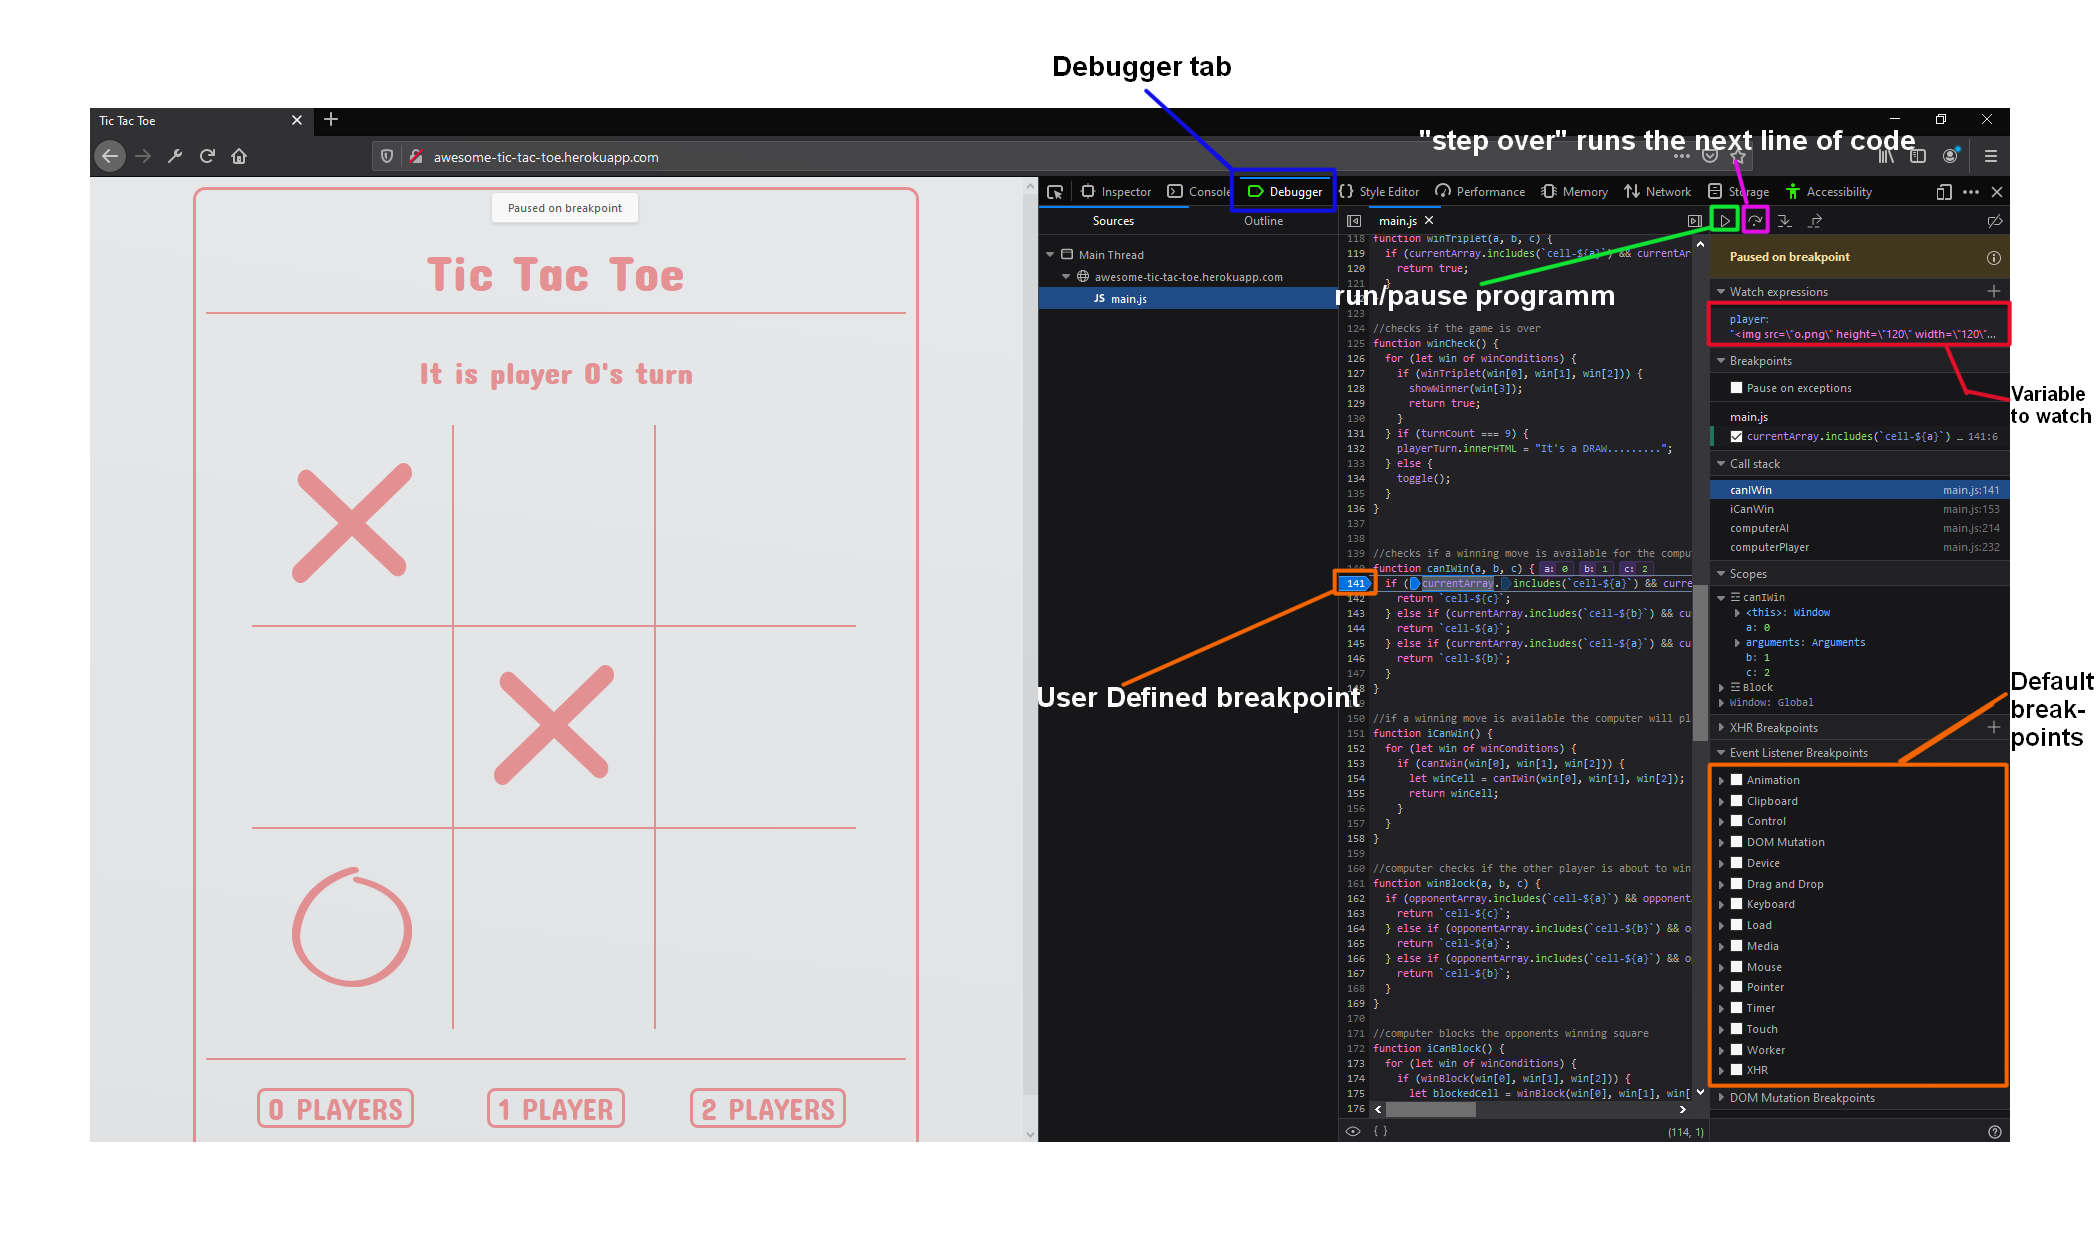
Once you've added a breakpoint run your code, and step through the section by clicking the step over button or pressing f10.
If you've stepped through your code, and are still having issues finding where the errors are coming, or you find yourself traversing through previously unknown code there are several things you may want to try:
Disable extensions
Run in 'incognito' mode to make sure you're not caching bad code
Try running the code in a different browser
Try running it in a 'pristine' browser (a fresh install with no extensions or settings changes)
Note: If your code runs on page load, you will need to refresh the page before the debugger takes effect.
/